



Server Monitoring Service
Monitor server uptime, resources, ports and selected services anywhere in the world from one clear operating view. Choose the per-server visibility your infrastructure actually needs.
Automated checks and alerts run continuously. Human investigation, incident response and remediation require a separately agreed management or response scope.

Illustrative live console
Live monitoring, as it happens
See how availability, resource pressure and alerts move through one clear monitoring view—without exposing real customer data.
- Uptime checks
- Resource signals
- Alert routing
Uptime in context
See the host, the network and the alert path together
Monitoring works best when external availability and internal server health are reviewed as one operating picture.

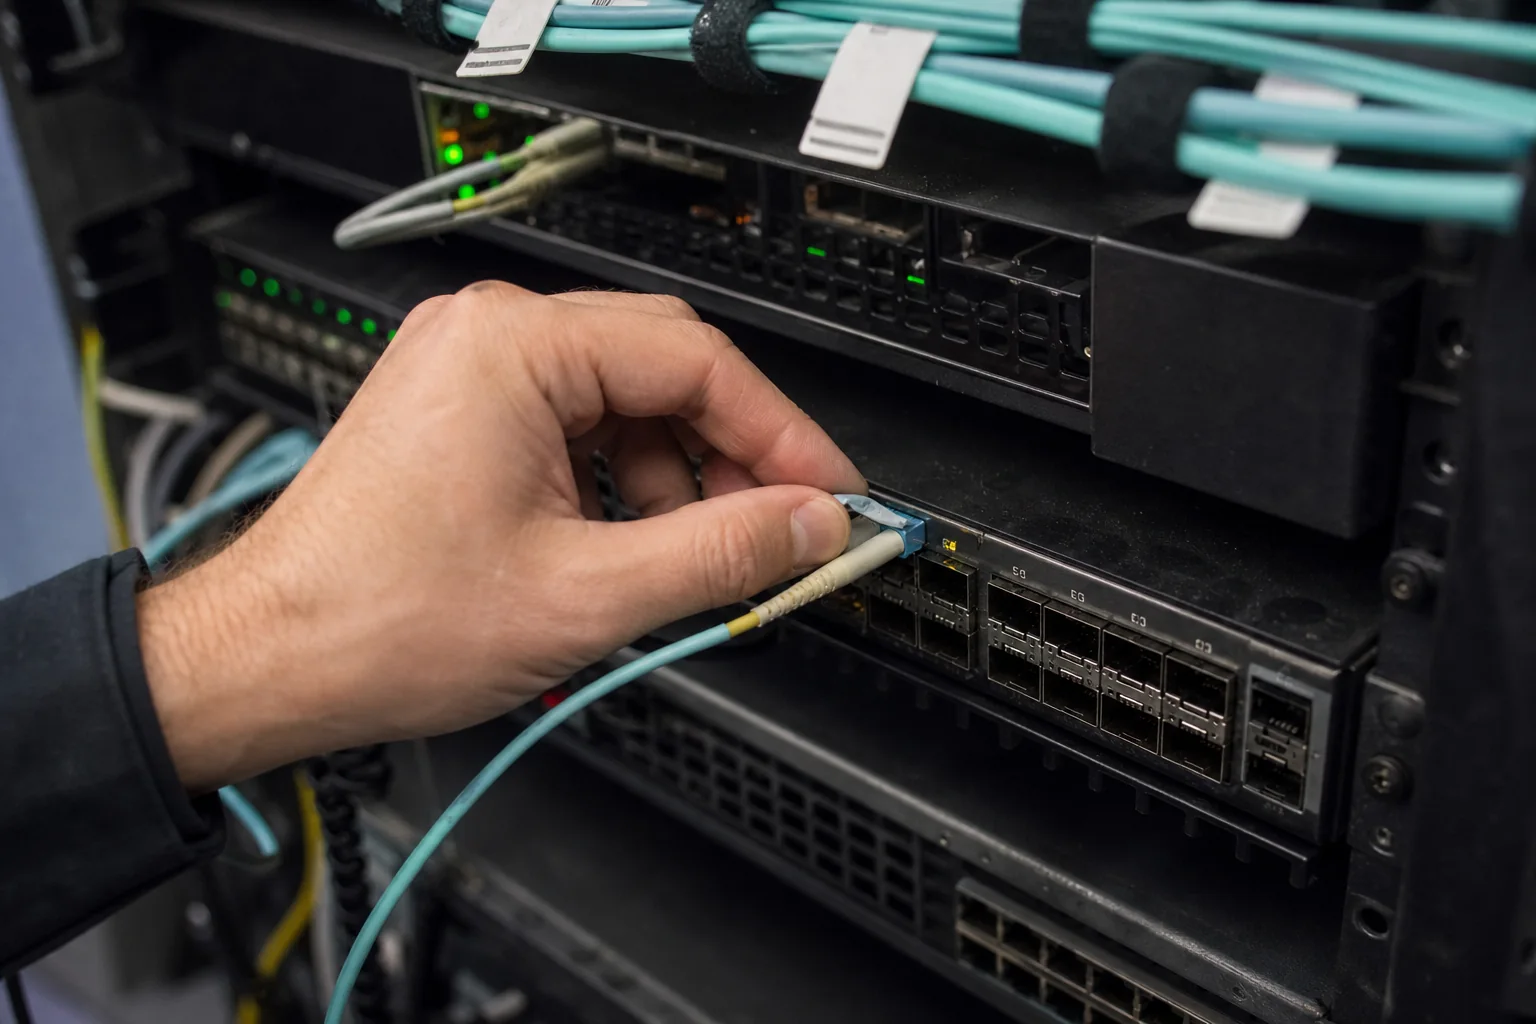

Know what is up, what is strained and what needs attention
Start with essential availability, then add deeper infrastructure and application context as your systems grow.
Endpoints and certificates
Check reachability and selected public services before an outage becomes a support complaint.
Capacity pressure inside the host
Observe the operating signals that help explain slowdowns and exhaustion.
Processes, services and containers
Watch selected workloads and thresholds beyond a simple up-or-down result.
DNS, mail and heartbeat signals
Surface expiring routes and missed scheduled signals before they become silent risks.
Choose the visibility depth your server needs
Four clear packages move from essential uptime checks to full-stack application observability.
Essential visibility
Monitor Basic
For one straightforward server.
$10per server / month
- Up/down and ICMP checks
- HTTP/HTTPS and TCP ports
- SSL expiry monitoring
- CPU, RAM, disk and load
- Basic email alerts
Deeper infrastructure
Infrastructure Pro
For production infrastructure.
$36per server / month
- Everything in Monitor Basic
- Network and disk I/O
- Inodes, processes and services
- Threshold alerts and dashboards
- 5 containers + 100 custom metrics
Recommended for critical servers
Intelligent Monitoring
For systems needing smarter signals.
$54per server / month
- Everything in Infrastructure Pro
- Anomaly, outlier and forecast alerts
- Live processes
- Advanced signal correlations
- 10 containers + 200 custom metrics
Application context
Full-Stack Observability
For one monitored application host.
$126per server / month
- Everything in Intelligent
- One application/APM host
- Traces and dependencies
- Throughput, latency and error rates
- Root-cause investigation context
Per-server service fee. Plans can be viewed in USD or BDT using the fixed display rate 1 USD = ৳125. The written quote confirms the billing currency, applicable taxes and any add-ons. Annual totals are fixed annual prices, not monthly price × 12. Scope reviewed 29 August 2026.
From basic reachability to useful operating context
Checks are selected around the server role, business impact and the alert noise your team can realistically act on.
Monitoring setup & baseline
Confirm the host, endpoints, expected behavior and starting thresholds.
Uptime & endpoint checks
Observe reachability, web endpoints, ports and certificate expiry.
Resource performance
Track CPU, load, memory, storage and network pressure.
Processes & services
Watch selected daemons, processes, containers and service states.
Network & port signals
Monitor interfaces, traffic, errors and important listening ports.
SSL, DNS & mail checks
Surface selected continuity risks across certificates and service routes.
Application signals
Add traces, latency, throughput, errors and dependencies where supported.
Alerts, dashboards & reports
Route practical alerts and review agreed trend summaries.
A clear path from signal to the right contact
Good monitoring begins with context, not a flood of default alarms.

01
Assess the server
Confirm services, dependencies, business impact and available access.
02
Connect checks
Install approved agents or configure external endpoints for the agreed plan.
03
Tune thresholds
Set useful limits, no-data rules and alert routes around expected behavior.
04
Validate and review
Test alert delivery, then refine noise and trends using observed data.
Monitoring tells you what happened. Remediation is a separate action.
The monitoring plan covers configured checks, alert delivery and reporting. Hands-on changes stay controlled and separately authorized.
Monitoring service
Included in the agreed plan
- Configured automated checks
- Threshold and no-data rules
- Alert routes and dashboards
- Scheduled trend summaries
- Monitoring configuration upkeep
Hands-on action
Quoted or supplied separately
- Incident investigation and remediation
- Server management and approved changes
- Premium licenses and alert credits
- Extra log ingestion or retention
- Custom application integrations
Need DianaHost to investigate or fix the server?Monitoring can identify the signal; hands-on maintenance and remediation remain a separately authorized service.View Server Management Service
Monitoring data supports operational decisions, but it does not by itself guarantee uptime, backup restorability, instant human response, automatic recovery or a fixed incident resolution time. One server means one OS instance or VM; extra hosts, endpoints, databases, log sources and heartbeat jobs can change the final scope.
Server Monitoring Service FAQs
Coverage, pricing and responsibilities explained clearly.
What can DianaHost monitor on a server?
DianaHost can monitor agreed availability, HTTP and HTTPS endpoints, ping, TCP ports, SSL expiry, CPU, memory, load, disks, network signals, processes, services, containers and selected application signals according to the plan.
How much does server monitoring cost?
Plans start at $10 (৳1,250) per server per month. Infrastructure Pro is $36 (৳4,500), Intelligent Monitoring is $54 (৳6,750) and Full-Stack Observability is $126 (৳15,750) per server per month.
How is annual server monitoring billed?
Annual per-server prices are $108 (৳13,500), $360 (৳45,000), $552 (৳69,000) or $1,296 (৳162,000), depending on the selected plan. These are fixed annual totals rather than monthly price × 12.
Can DianaHost monitor servers in any country or cloud region?
DianaHost can monitor eligible servers worldwide, including cloud VPS, dedicated and colocated infrastructure. Coverage can combine public endpoint checks with approved host agents for CPU, memory, storage, processes and services. Final support depends on the operating system, network reachability and secure access.
Which plan includes application performance monitoring and traces?
Full-Stack Observability includes one supported application or APM host with traces, throughput, latency, error rates, dependencies and root-cause investigation context.
Does monitoring include incident remediation?
No. Monitoring includes configured automated checks, alerts, dashboards and agreed reports. Human investigation, configuration changes and remediation require a separately agreed Server Management or incident response scope.
Is database monitoring included?
Basic database service availability may be checked where agreed. Deep database monitoring is a separate add-on because it requires a supported engine, approved read-only credentials and a custom scope.
What access is required to start monitoring?
External checks may only need public endpoints. Host, process, container or application metrics normally require an approved monitoring agent or read-only integration access provided through a secure agreed method.